Patients prioritized disease control, limiting side effects, and living longer1
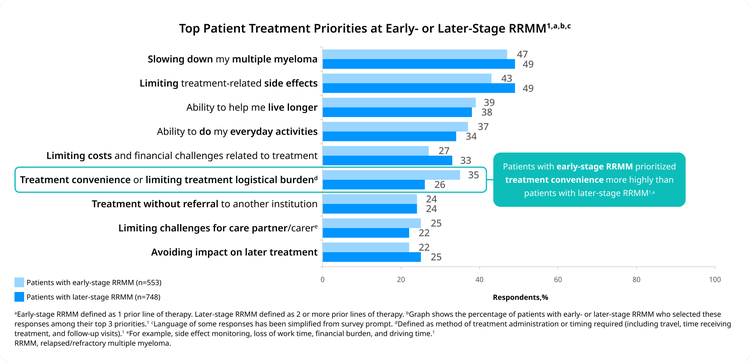
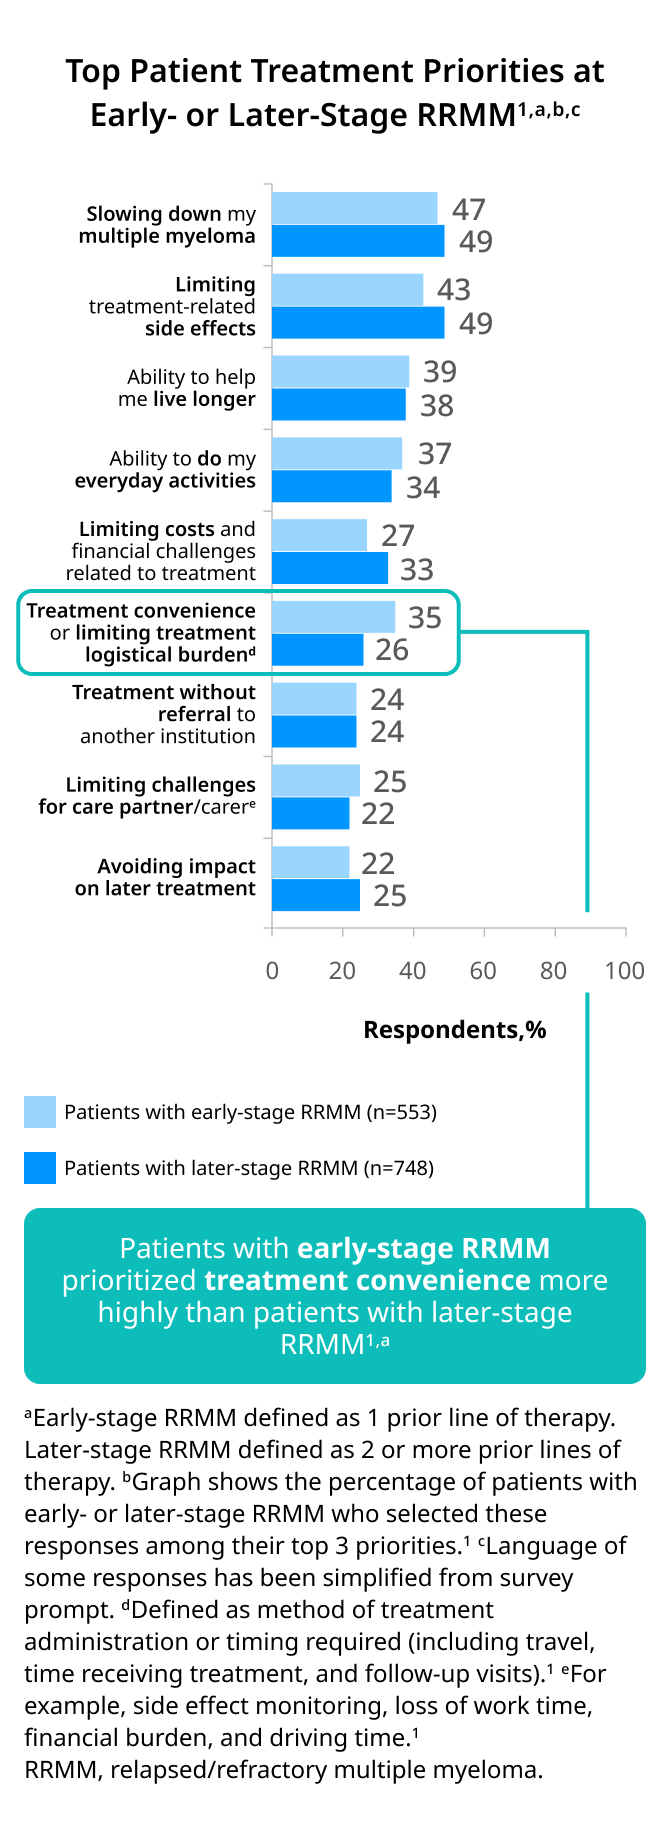
A horizontal bar chart titled "Patients prioritized disease control, limiting side effects, and living longer¹". The x-axis represents the percentage of respondents from 0 to 100. The y-axis lists various treatment priorities. T The legend indicates that light blue bars represent "Patients with early-stage RRMM (n=553)" and dark blue bars represent "Patients with later-stage RRMM (n=748)". The data is as follows: Slowing down my multiple myeloma: 47% for early-stage, 49% for later-stage. Limiting treatment-related side effects: 43% for early-stage, 49% for later-stage. Ability to help me live longer: 39% for early-stage, 38% for later-stage. Ability to do my everyday activities: 37% for early-stage, 34% for later-stage. Limiting costs and financial challenges related to treatment: 27% for early-stage, 33% for later-stage. Treatment convenience or limiting treatment logistical burden: 35% for early-stage, 26% for later-stage. This bar is highlighted with a callout box that reads, "Patients with early-stage RRMM prioritized treatment convenience more highly than patients with later-stage RRMM¹,a". Treatment without referral to another institution: 24% for early-stage, 24% for later-stage. Limiting challenges for care partner/carer: 25% for early-stage, 22% for later-stage. Avoiding impact on later treatment: 22% for early-stage, 25% for later-stage.

A horizontal bar chart titled "Patients prioritized disease control, limiting side effects, and living longer¹". The x-axis represents the percentage of respondents from 0 to 100. The y-axis lists various treatment priorities. T The legend indicates that light blue bars represent "Patients with early-stage RRMM (n=553)" and dark blue bars represent "Patients with later-stage RRMM (n=748)". The data is as follows: Slowing down my multiple myeloma: 47% for early-stage, 49% for later-stage. Limiting treatment-related side effects: 43% for early-stage, 49% for later-stage. Ability to help me live longer: 39% for early-stage, 38% for later-stage. Ability to do my everyday activities: 37% for early-stage, 34% for later-stage. Limiting costs and financial challenges related to treatment: 27% for early-stage, 33% for later-stage. Treatment convenience or limiting treatment logistical burden: 35% for early-stage, 26% for later-stage. This bar is highlighted with a callout box that reads, "Patients with early-stage RRMM prioritized treatment convenience more highly than patients with later-stage RRMM¹,a". Treatment without referral to another institution: 24% for early-stage, 24% for later-stage. Limiting challenges for care partner/carer: 25% for early-stage, 22% for later-stage. Avoiding impact on later treatment: 22% for early-stage, 25% for later-stage.

Click to see Patient Treatment Priorities grouped by:

Age

Financial Situation

Care Setting

Country

Priorities for Patients With Comorbidities1

Patients with comorbidities, regardless of age, were more likely to prioritize limiting treatment-related side effects than their counterparts (52% vs 32%; P=.055)

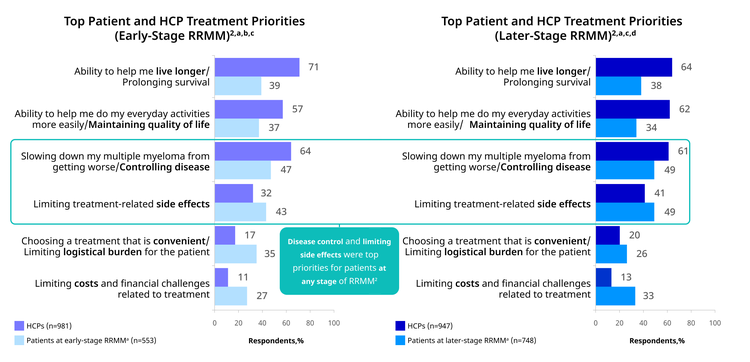
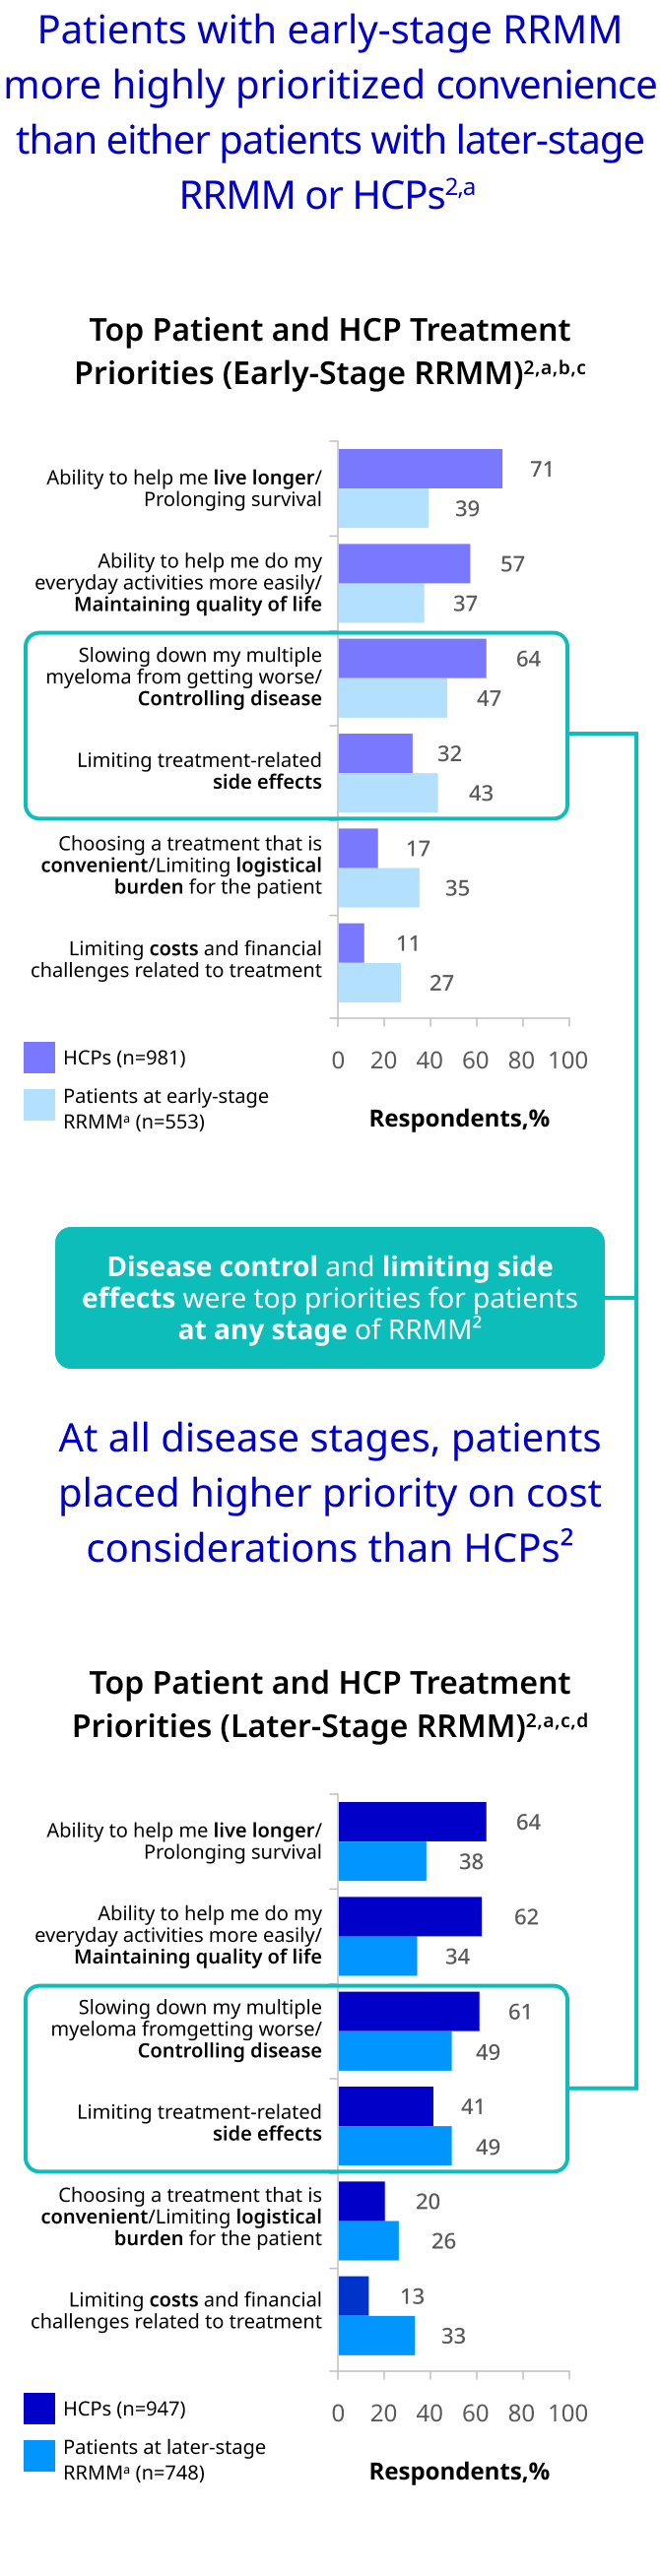
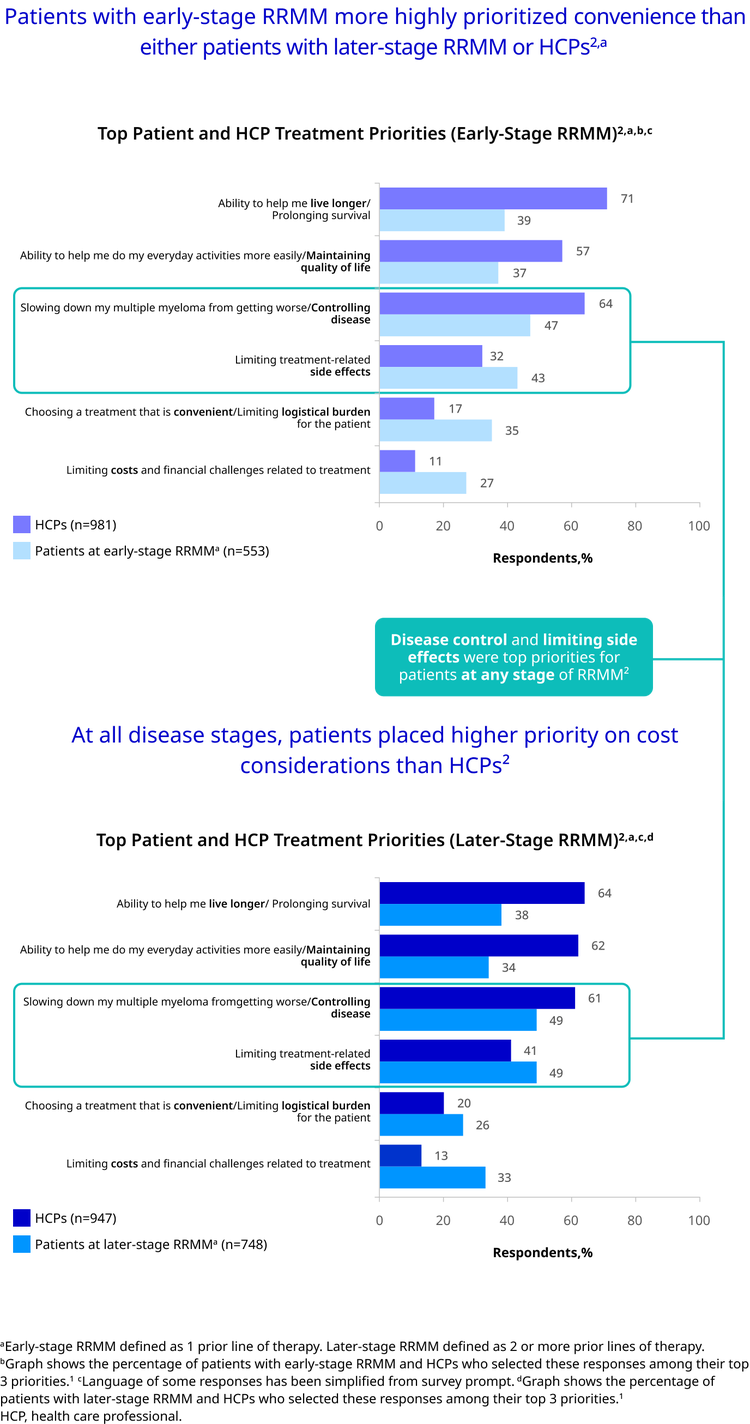
HCPs generally prioritized efficacy and quality of life, while patient goals were more varied1,2

To assess RRMM treatment goals, the survey asked patients and HCPs to select their top 3 priorities when starting a new treatment1,2

A figure with two horizontal bar charts comparing the treatment priorities of patients and healthcare professionals (HCPs). The title on the left reads, "Patients with early-stage RRMM more highly prioritized convenience than either patients with later-stage RRMM or HCPs²,a". The title on the right reads, "At all disease stages, patients placed higher priority on cost considerations than HCPs²". Chart 1: Top Patient and HCP Treatment Priorities (Early-Stage RRMM)²,a,b,c This chart compares HCPs (n=981, purple bars) with Patients at early-stage RRMM (n=553, light blue bars). The x-axis is "Respondents, %". Ability to help me live longer/Prolonging survival: HCPs: 71%, Patients: 39% Ability to help me do my everyday activities more easily/Maintaining quality of life: HCPs: 57%, Patients: 37% Slowing down my multiple myeloma from getting worse/Controlling disease: HCPs: 64%, Patients: 47% Limiting treatment-related side effects: HCPs: 32%, Patients: 43% Choosing a treatment that is convenient/Limiting logistical burden for the patient: HCPs: 17%, Patients: Bar is shown to be significantly higher than HCPs, but the percentage value is not provided. Limiting costs and financial challenges related to treatment: HCPs: 11%, Patients: 27% A callout box highlights the bottom four priorities, stating "Disease control and limiting side effects were top priorities for patients at any stage of RRMM²". Chart 2: Top Patient and HCP Treatment Priorities (Later-Stage RRMM)²,a,c,d This chart compares HCPs (n=947, dark blue bars) with Patients at later-stage RRMM (n=748, medium blue bars). The x-axis is "Respondents, %". Ability to help me live longer/Prolonging survival: HCPs: 64%, Patients: 38% Ability to help me do my everyday activities more easily/Maintaining quality of life: HCPs: 62%, Patients: 34% Slowing down my multiple myeloma from getting worse/Controlling disease: HCPs: 61%, Patients: 49% Limiting treatment-related side effects: HCPs: 41%, Patients: 49% Choosing a treatment that is convenient/Limiting logistical burden for the patient: HCPs: 20%, Patients: 26% Limiting costs and financial challenges related to treatment: HCPs: 13%, Patients: 33% An outline highlights the "Slowing down my multiple myeloma..." and "Limiting treatment-related side effects" categories on this chart.

A figure with two horizontal bar charts comparing the treatment priorities of patients and healthcare professionals (HCPs). The title on the left reads, "Patients with early-stage RRMM more highly prioritized convenience than either patients with later-stage RRMM or HCPs²,a". The title on the right reads, "At all disease stages, patients placed higher priority on cost considerations than HCPs²". Chart 1: Top Patient and HCP Treatment Priorities (Early-Stage RRMM)²,a,b,c This chart compares HCPs (n=981, purple bars) with Patients at early-stage RRMM (n=553, light blue bars). The x-axis is "Respondents, %". Ability to help me live longer/Prolonging survival: HCPs: 71%, Patients: 39% Ability to help me do my everyday activities more easily/Maintaining quality of life: HCPs: 57%, Patients: 37% Slowing down my multiple myeloma from getting worse/Controlling disease: HCPs: 64%, Patients: 47% Limiting treatment-related side effects: HCPs: 32%, Patients: 43% Choosing a treatment that is convenient/Limiting logistical burden for the patient: HCPs: 17%, Patients: Bar is shown to be significantly higher than HCPs, but the percentage value is not provided. Limiting costs and financial challenges related to treatment: HCPs: 11%, Patients: 27% A callout box highlights the bottom four priorities, stating "Disease control and limiting side effects were top priorities for patients at any stage of RRMM²". Chart 2: Top Patient and HCP Treatment Priorities (Later-Stage RRMM)²,a,c,d This chart compares HCPs (n=947, dark blue bars) with Patients at later-stage RRMM (n=748, medium blue bars). The x-axis is "Respondents, %". Ability to help me live longer/Prolonging survival: HCPs: 64%, Patients: 38% Ability to help me do my everyday activities more easily/Maintaining quality of life: HCPs: 62%, Patients: 34% Slowing down my multiple myeloma from getting worse/Controlling disease: HCPs: 61%, Patients: 49% Limiting treatment-related side effects: HCPs: 41%, Patients: 49% Choosing a treatment that is convenient/Limiting logistical burden for the patient: HCPs: 20%, Patients: 26% Limiting costs and financial challenges related to treatment: HCPs: 13%, Patients: 33% An outline highlights the "Slowing down my multiple myeloma..." and "Limiting treatment-related side effects" categories on this chart.

A figure with two horizontal bar charts comparing the treatment priorities of patients and healthcare professionals (HCPs). The title on the left reads, "Patients with early-stage RRMM more highly prioritized convenience than either patients with later-stage RRMM or HCPs²,a". The title on the right reads, "At all disease stages, patients placed higher priority on cost considerations than HCPs²". Chart 1: Top Patient and HCP Treatment Priorities (Early-Stage RRMM)²,a,b,c This chart compares HCPs (n=981, purple bars) with Patients at early-stage RRMM (n=553, light blue bars). The x-axis is "Respondents, %". Ability to help me live longer/Prolonging survival: HCPs: 71%, Patients: 39% Ability to help me do my everyday activities more easily/Maintaining quality of life: HCPs: 57%, Patients: 37% Slowing down my multiple myeloma from getting worse/Controlling disease: HCPs: 64%, Patients: 47% Limiting treatment-related side effects: HCPs: 32%, Patients: 43% Choosing a treatment that is convenient/Limiting logistical burden for the patient: HCPs: 17%, Patients: Bar is shown to be significantly higher than HCPs, but the percentage value is not provided. Limiting costs and financial challenges related to treatment: HCPs: 11%, Patients: 27% A callout box highlights the bottom four priorities, stating "Disease control and limiting side effects were top priorities for patients at any stage of RRMM²". Chart 2: Top Patient and HCP Treatment Priorities (Later-Stage RRMM)²,a,c,d This chart compares HCPs (n=947, dark blue bars) with Patients at later-stage RRMM (n=748, medium blue bars). The x-axis is "Respondents, %". Ability to help me live longer/Prolonging survival: HCPs: 64%, Patients: 38% Ability to help me do my everyday activities more easily/Maintaining quality of life: HCPs: 62%, Patients: 34% Slowing down my multiple myeloma from getting worse/Controlling disease: HCPs: 61%, Patients: 49% Limiting treatment-related side effects: HCPs: 41%, Patients: 49% Choosing a treatment that is convenient/Limiting logistical burden for the patient: HCPs: 20%, Patients: 26% Limiting costs and financial challenges related to treatment: HCPs: 13%, Patients: 33% An outline highlights the "Slowing down my multiple myeloma..." and "Limiting treatment-related side effects" categories on this chart.

aEarly-stage RRMM defined as 1 prior line of therapy. Later-stage RRMM defined as 2 or more prior lines of therapy. bGraph shows the percentage of patients with early-stage RRMM and HCPs who selected these responses among their top 3 priorities.1 cLanguage of some responses has been simplified from survey prompt. dGraph shows the percentage of patients with later-stage RRMM and HCPs who selected these responses among their top 3 priorities.1

HCP, health care professional.

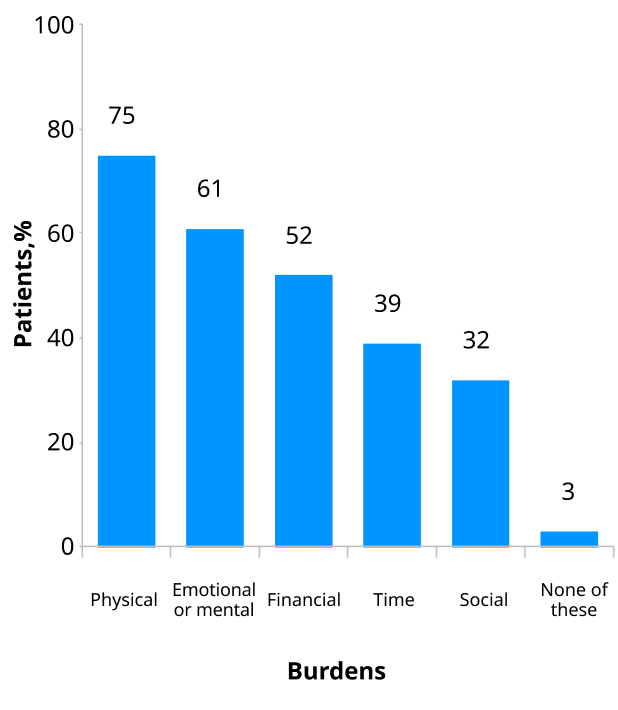
MM Management Burdens Reported by Patients (n=1301)3
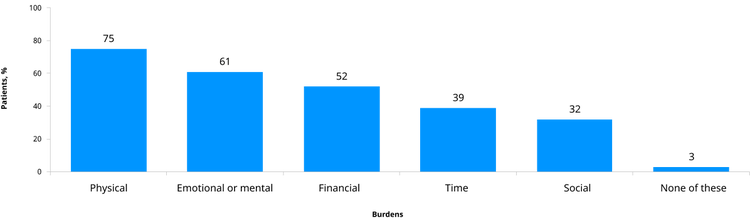
A bar chart titled "MM Management Burdens Reported by Patients (n=1301)³". The vertical axis represents the percentage of patients, ranging from 0 to 100. The horizontal axis lists different types of burdens. The data presented is as follows: Physical: 75% Emotional or mental: 61% Financial: 52% Time: 39% Social: 32% None of these: 3% A bar chart titled "MM Management Burdens Reported by Patients (n=1301)³". The vertical axis represents the percentage of patients, ranging from 0 to 100. The horizontal axis lists different types of burdens. The data presented is as follows: Physical: 75% Emotional or mental: 61% Financial: 52% Time: 39% Social: 32% None of these: 3%

MM, multiple myeloma.

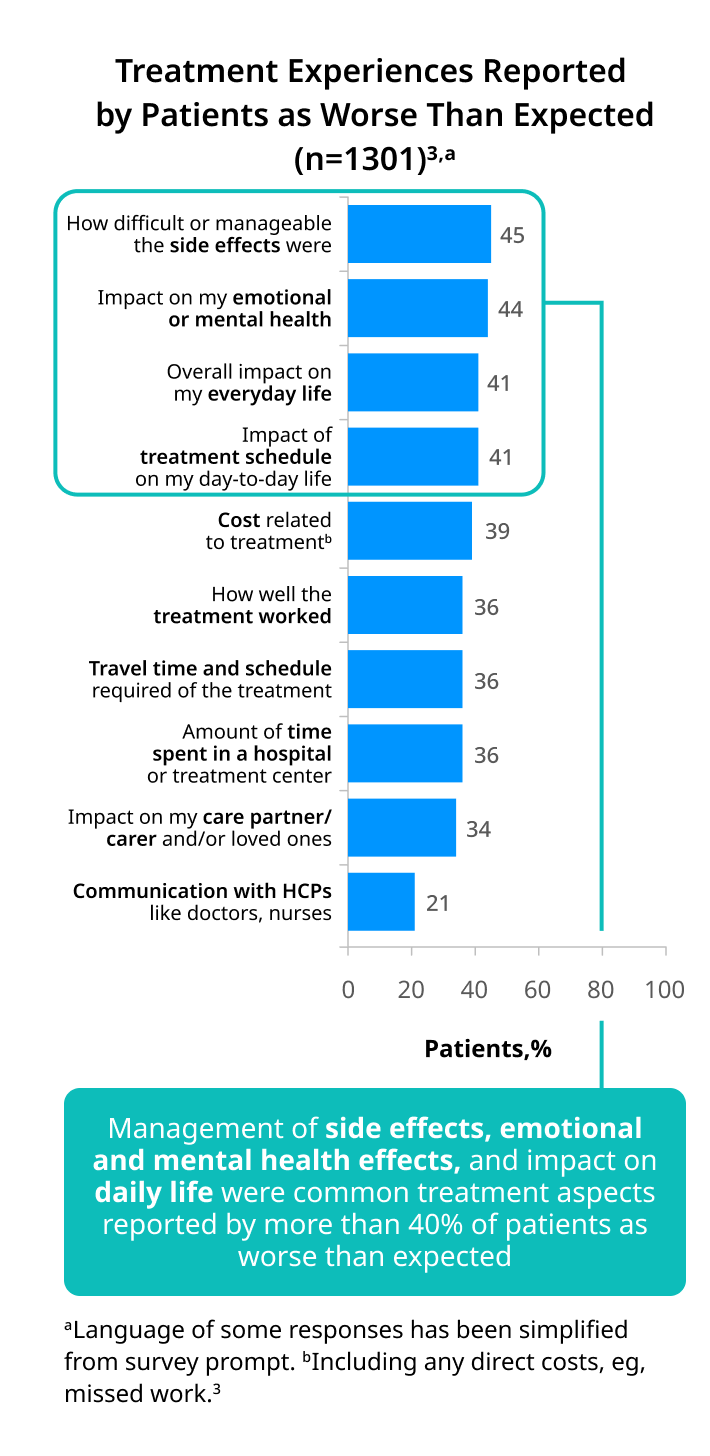
Patients reported certain aspects of MM treatment that did not meet expectations3
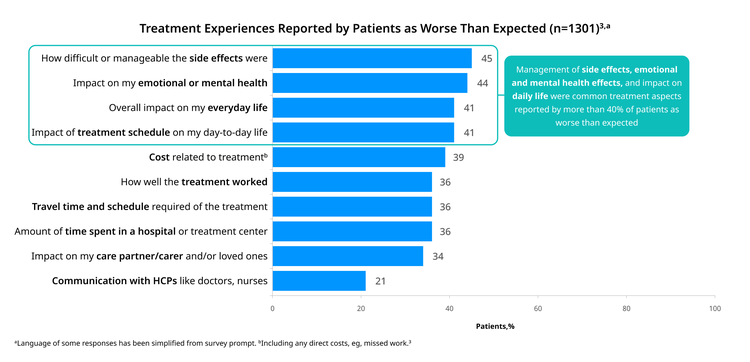
A horizontal bar chart titled "Treatment Experiences Reported by Patients as Worse Than Expected (n=1301)³,a". The x-axis represents the percentage of patients, ranging from 0 to 100. The y-axis lists various treatment experiences. The data presented is as follows: How difficult or manageable the side effects were: 45% Impact on my emotional or mental health: 44% Overall impact on my everyday life: 41% Impact of treatment schedule on my day-to-day life: 41% Cost related to treatment: 39% How well the treatment worked: 36% Travel time and schedule required of the treatment: 36% Amount of time spent in a hospital or treatment center: 36% Impact on my care partner/carer and/or loved ones: 34% Communication with HCPs like doctors, nurses: 21% A callout box highlights the top four bars and states: "Management of side effects, emotional and mental health effects, and impact on daily life were common treatment aspects reported by more than 40% of patients as worse than expected". A horizontal bar chart titled "Treatment Experiences Reported by Patients as Worse Than Expected (n=1301)³,a". The x-axis represents the percentage of patients, ranging from 0 to 100. The y-axis lists various treatment experiences. The data presented is as follows: How difficult or manageable the side effects were: 45% Impact on my emotional or mental health: 44% Overall impact on my everyday life: 41% Impact of treatment schedule on my day-to-day life: 41% Cost related to treatment: 39% How well the treatment worked: 36% Travel time and schedule required of the treatment: 36% Amount of time spent in a hospital or treatment center: 36% Impact on my care partner/carer and/or loved ones: 34% Communication with HCPs like doctors, nurses: 21% A callout box highlights the top four bars and states: "Management of side effects, emotional and mental health effects, and impact on daily life were common treatment aspects reported by more than 40% of patients as worse than expected".

Click to see other factors associated with Patient Treatment Expectations including:

Age

Sex

Disease Stage

Comorbidities

Financial Situation

Patients preferred to be involved in treatment decisions of specific topics3,4

Patients preferred making treatment decisions together with their HCPs3


HCPs reported discussing treatment goals with patients before recommending treatment3

aIncluding any additional care needed.3

Common topics patients learned from HCPs included side effects as well as clinical trial outcomes and eligibility (n=1301)3
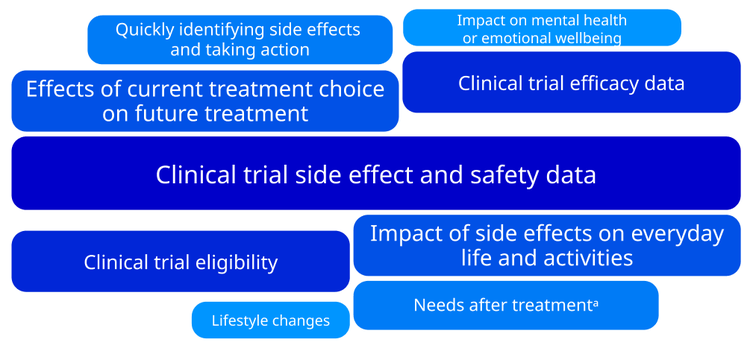
A word cloud graphic titled, "Common topics patients learned from HCPs included side effects as well as clinical trial outcomes and eligibility (n=1301)³". The graphic displays various topics in blue boxes of different sizes, indicating their relative importance or frequency. The topics listed are: Large, dark blue boxes: Clinical trial side effect and safety data Effects of current treatment choice on future treatment Clinical trial efficacy data Clinical trial eligibility Impact of side effects on everyday life and activities Medium, lighter blue boxes: Quickly identifying side effects and taking action Needs after treatment Small, lighter blue boxes: Impact on mental health or emotional wellbeing Lifestyle changes

Treatment decision topics were generally similar across regions with some differences in select countries3,4

Click for findings that differed in certain countries

Patients wanted HCPs to spend more time discussing treatment topics ranging from side effects and mental health to future treatments and costs3

Key Treatment Topicsa Patients Wanted HCPs to Further Discuss (n=1301)3,b,c

Clinical trial side effect and safety data
Impact on mental health or emotional wellbeing
Effects of current treatment choices on future treatment
Direct and indirect treatment costsd
Impact of side effects on everyday life and activities


aDefined as topics reported by at least 40% of patients to not be discussed enough by their HCPs. bWhen their most recent MM treatment was being decided.3 cLanguage of some responses has been simplified from survey prompt. dIndirect costs are defined as costs outside of the treatment itself, eg, travel costs and missed work.3

Steering Committee Recommendations on Positive Steps for the MM Community to Consider
CALL TO ACTION

Support increased access to support services, such as social workers, counselors, gerontologists, and patient navigators, and identify opportunities to reduce treatment-related financial burdens

Who Can Take Action?

Patient advocacy groups, payers, policymakers, industry

Rationale

This survey found that patients experience a variety of treatment-related burdens, including side effects, psychological impacts, logistical difficulties, and financial challenges.1

Increasing access to support services may help alleviate many of these treatment-related burdens. For instance, counselors can help navigate the impact of care on mental health, while gerontologists can help provide care that addresses the specific needs of elderly patients.5 Nonclinical support staff, such as patient navigators and social workers, may help patients access resources that address logistic and cost considerations.6 Increasing the financial resources for patients, and better communicating the available resources, may also help ease treatment-related financial burdens.6-8

Support studies to investigate if dosing regimens can be made more convenient for patients without compromising efficacy

Who Can Take Action?

Researchers, HCPs, industry

Rationale

Changes to dosing regimens, such as reducing how often treatments need to be taken and including breaks from treatment in responding patients, can increase convenience for patients.9,10 These changes may also reduce side effects and financial challenges, easing many patient burdens.10,11

Develop discussion tools in partnership with patient advocacy groups to help foster a more cohesive dialogue between patients and HCPs

Who Can Take Action?

Researchers, HCPs, patients, patient advocacy groups

Rationale

Survey findings indicate treatment goals differ between patients and HCPs.1 Additionally, treatment goals and patient perceptions are impacted by many factors, including age, the presence of comorbidities, and the number of times the patient has relapsed.1 Developing and using shared decision-making tools may help ensure patients are receiving the care that best aligns with their unique treatment goals.12-14

References